CIRMS GUI Screenshots

Real product views of the CIRMS operational interface: centralized system overview, automation, health monitoring and GL4 AI Data Readiness.

Real CIRMS interface

Control, monitoring and proactive management.

CIRMS provides a set of operational dashboards designed to give teams centralized visibility across automation, health monitoring, infrastructure information and AI Data Readiness. Together, the dashboards help technical teams and managers understand current status, identify areas requiring attention and review the operational information collected by CIRMS. These are real CIRMS GUI captures supplied by TOHOL, not generated mockups.

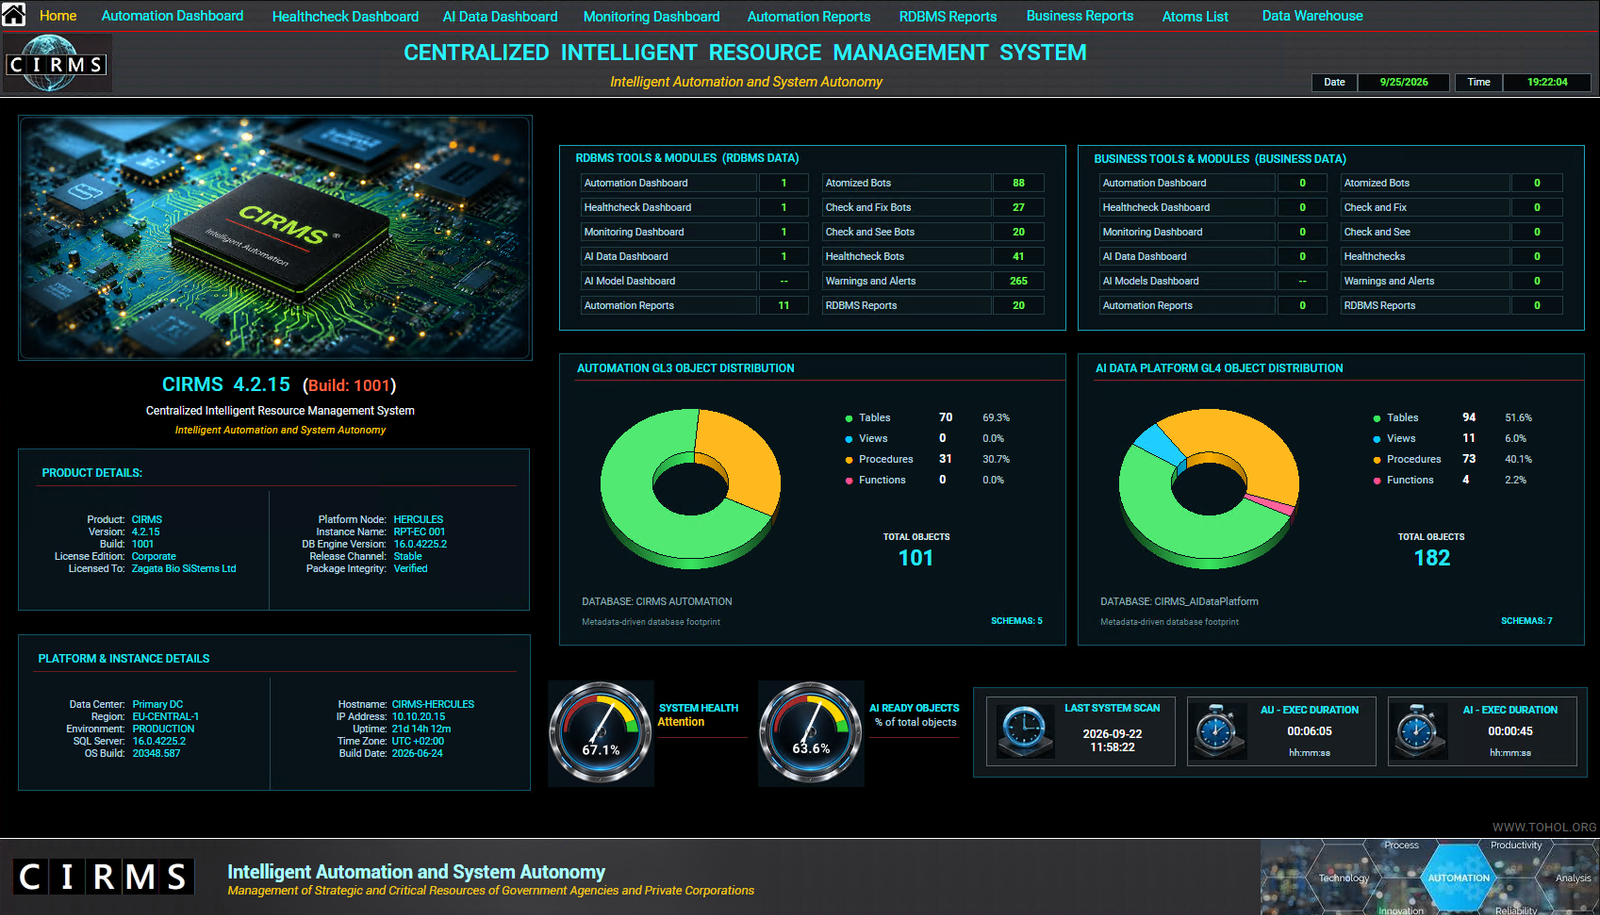
Captured product state. The Home view identifies CIRMS 4.2.15 (Build 1001). Dates, counts, health states and readiness values are the values visible at capture time; they are not live website data or benchmark claims.

CIRMS Home interface showing system overview, product details, GL3 and GL4 object distribution, health and readiness indicators.
System overview

CIRMS Home — Centralized Operational Overview

The CIRMS Home dashboard provides a consolidated view of the deployed platform, combining product and instance information, available tools and modules, GL3 and GL4 object distribution, system health, AI readiness and recent execution information. It acts as the operational entry point into the CIRMS environment, allowing users to move quickly between Automation, Healthcheck, Monitoring, AI Data, Reports and Data Warehouse functions.

  • Product, build, platform and instance details
  • RDBMS and business tools and modules
  • GL3 / GL4 object distribution and readiness indicators
  • System health, latest scan and execution timing
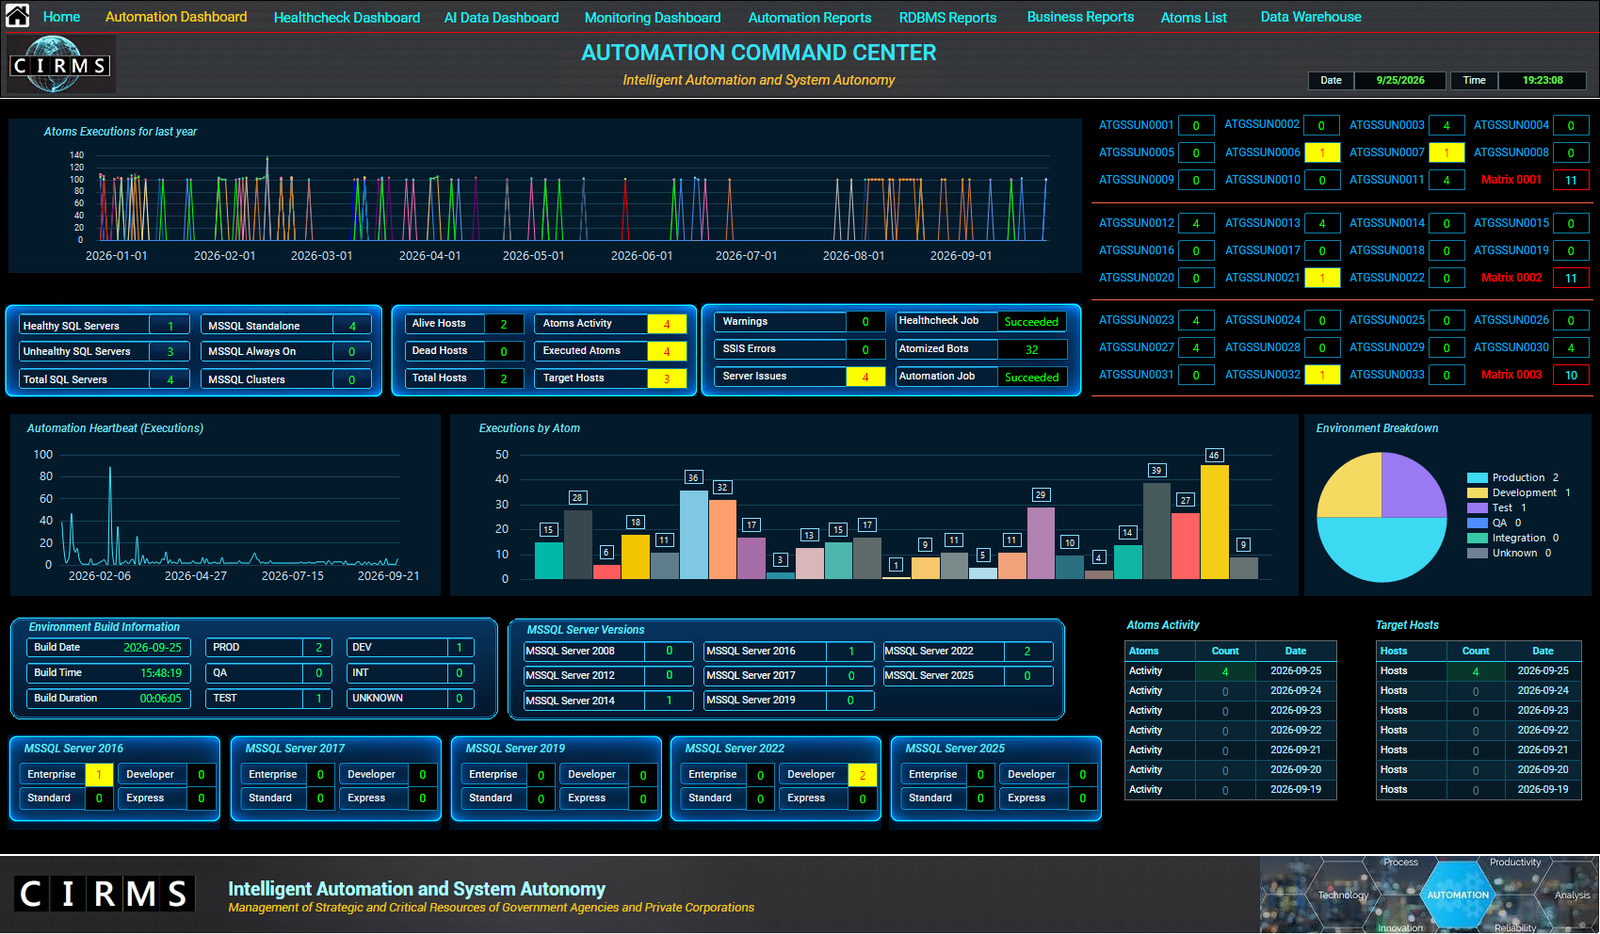
CIRMS Automation Command Center showing atom executions, host status, automation activity, execution history and environment breakdown.
GL3 automation

Automation Command Center — Execution and Operational Visibility

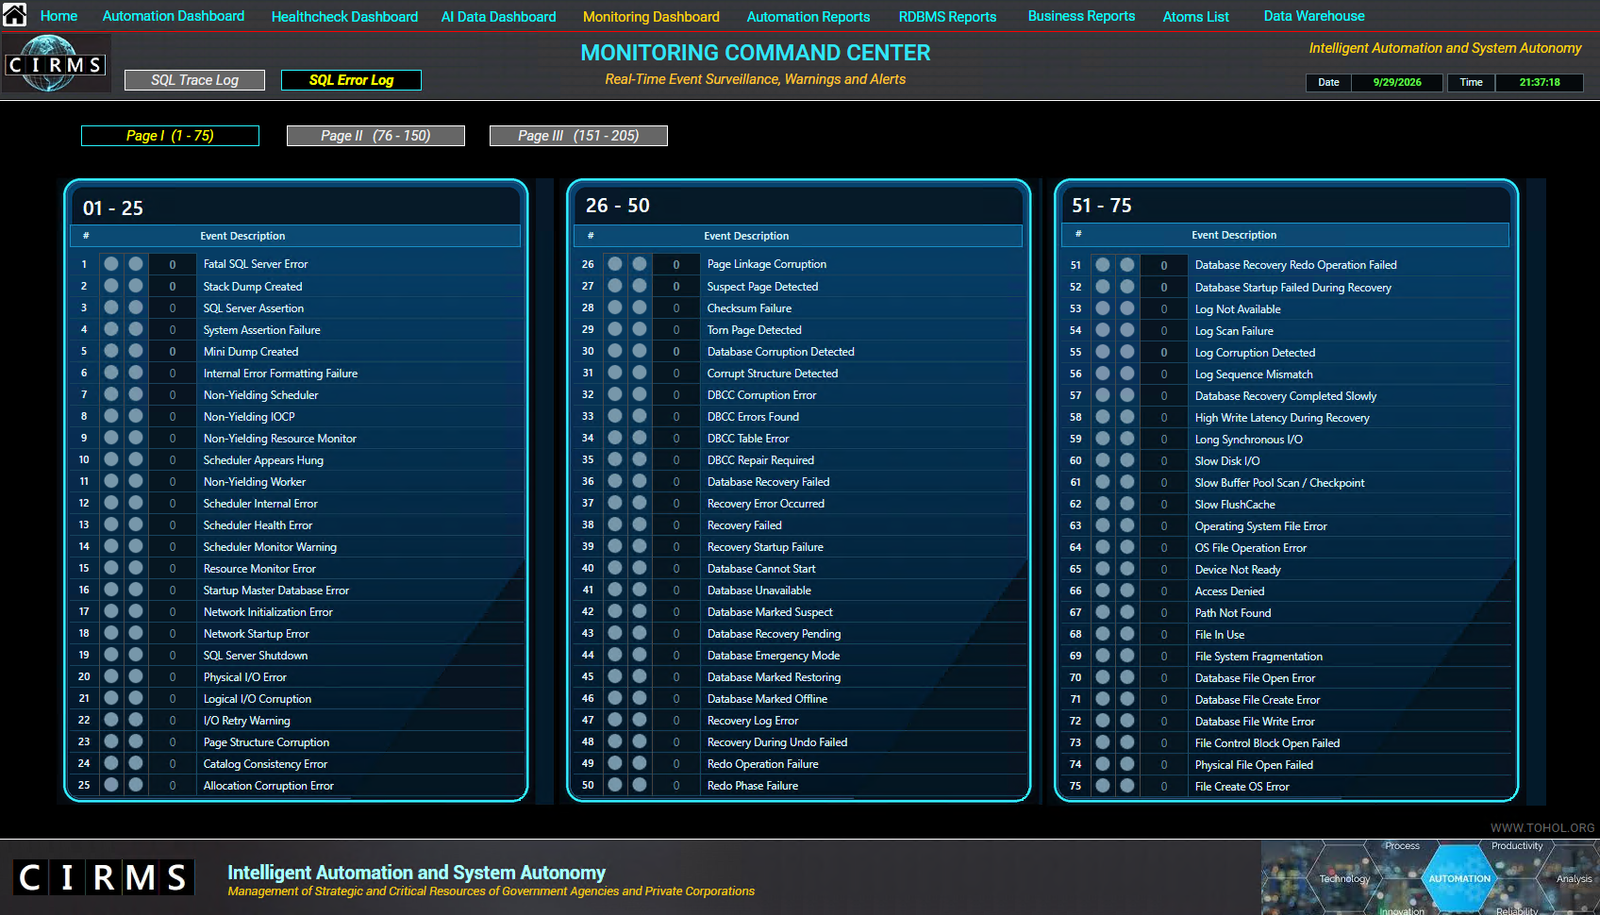
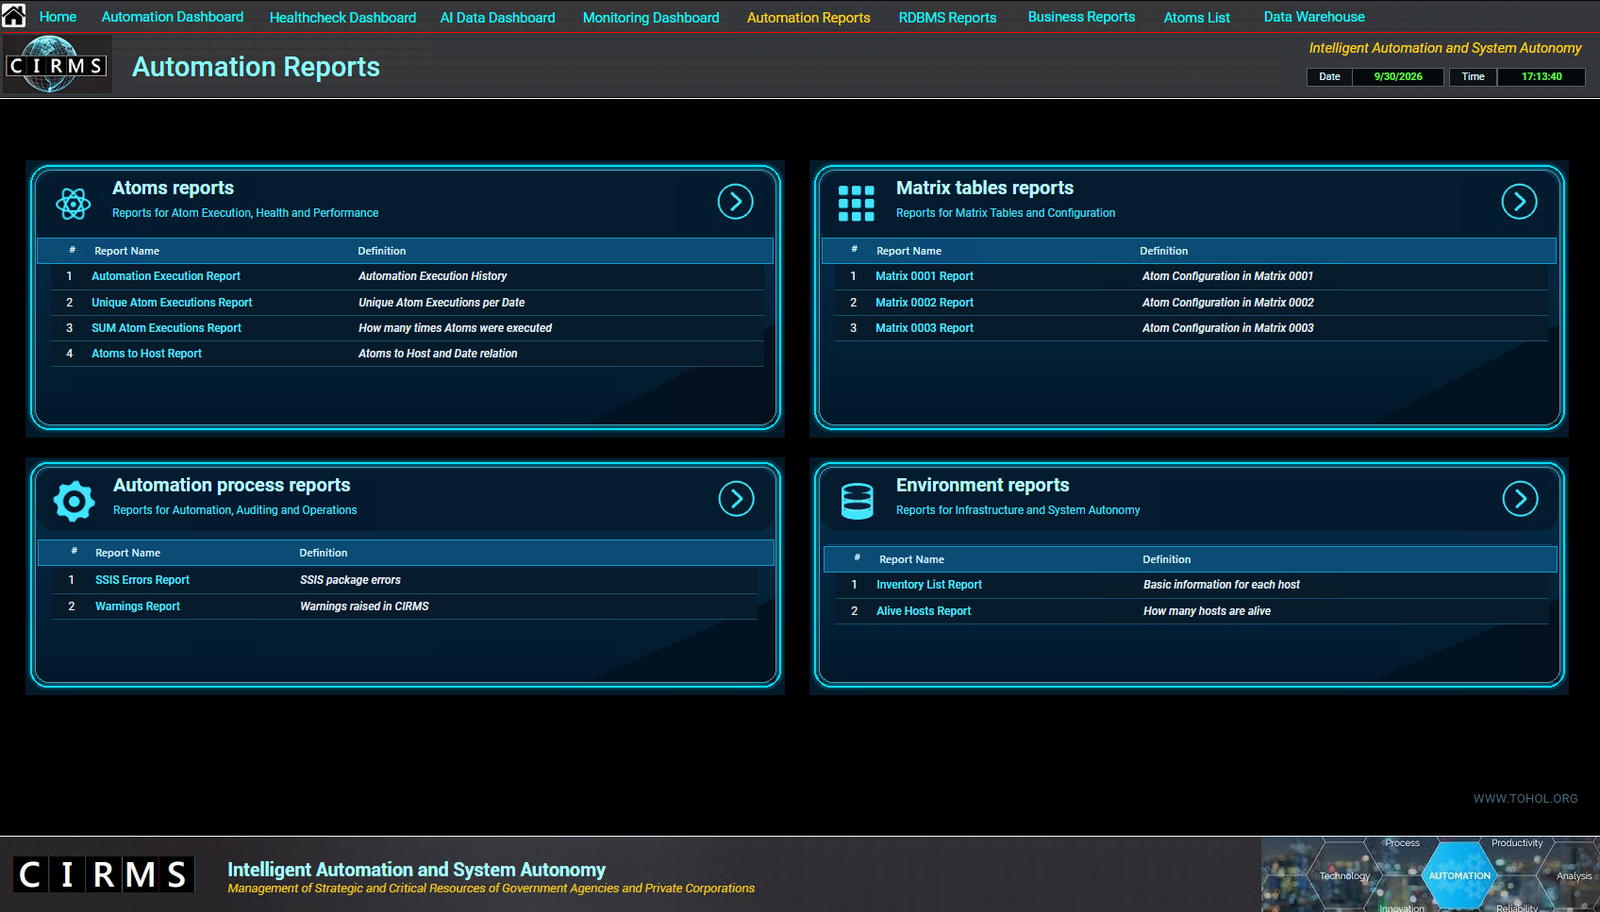
The Automation Command Center provides centralized visibility into automated execution across managed environments. It presents execution activity, target hosts, warnings and errors, environment distribution, SQL Server information and historical automation activity in one operational view. The dashboard helps teams review execution status, identify failed or problematic tasks and understand how automation is distributed across hosts and environments.

  • Atom execution history, heartbeat and activity
  • Host, target-host and environment status
  • Warnings, errors and execution counts by atom
  • Build information and SQL Server version distribution
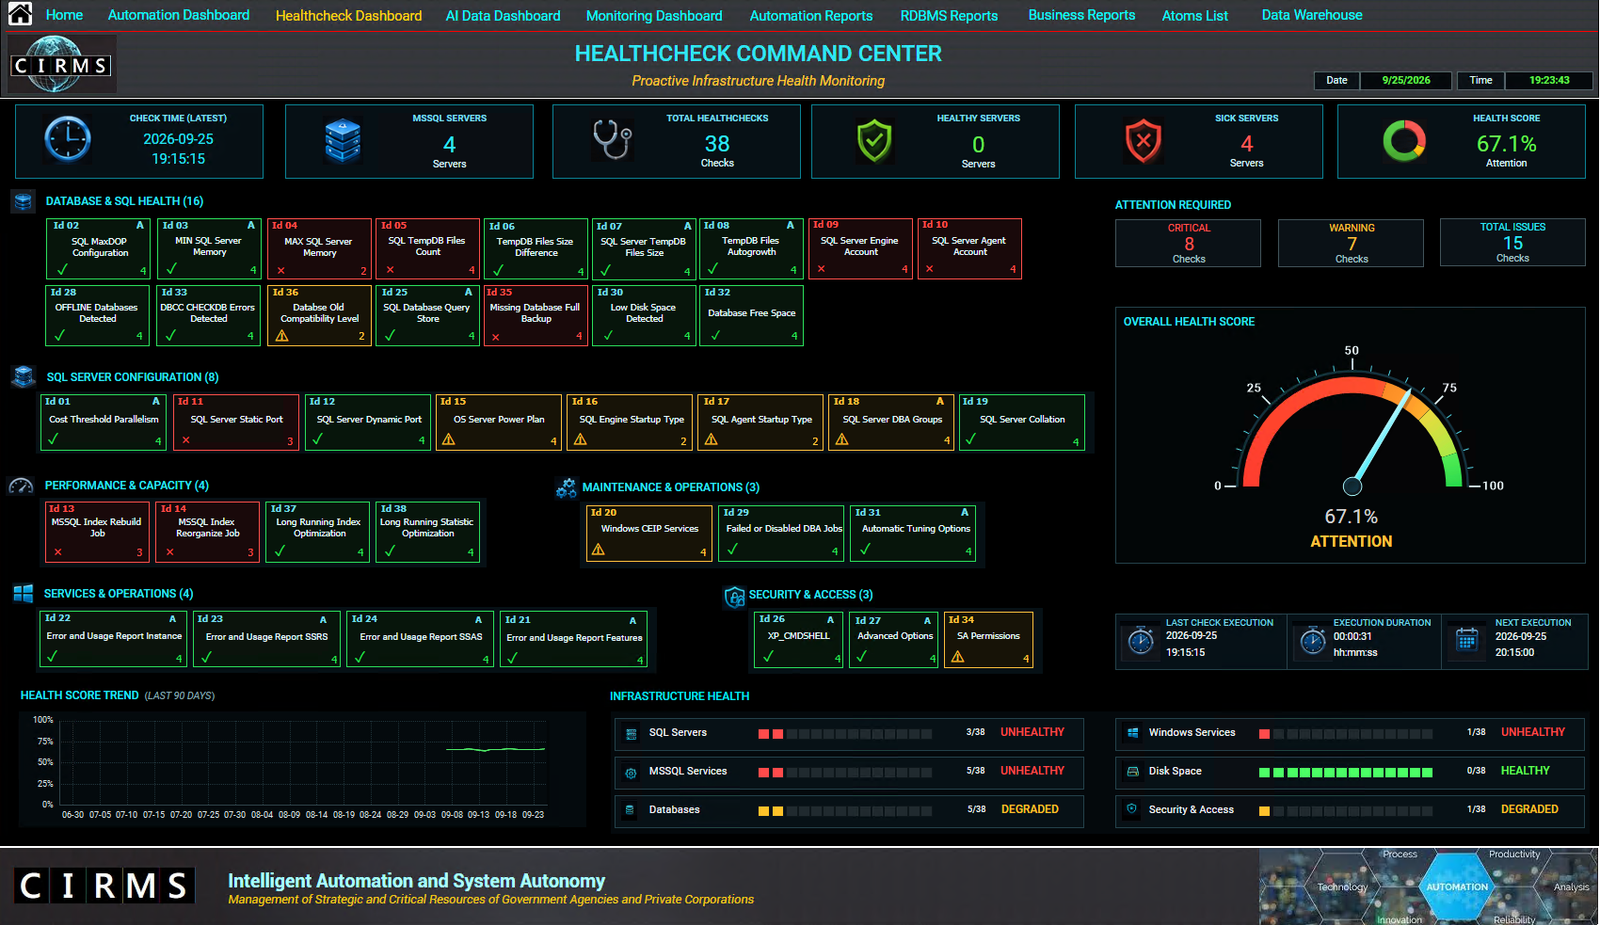
CIRMS Healthcheck Command Center showing categorized checks, attention levels, overall health score, trends and infrastructure health.
Proactive health monitoring

Healthcheck Command Center — Proactive Monitoring and System Integrity

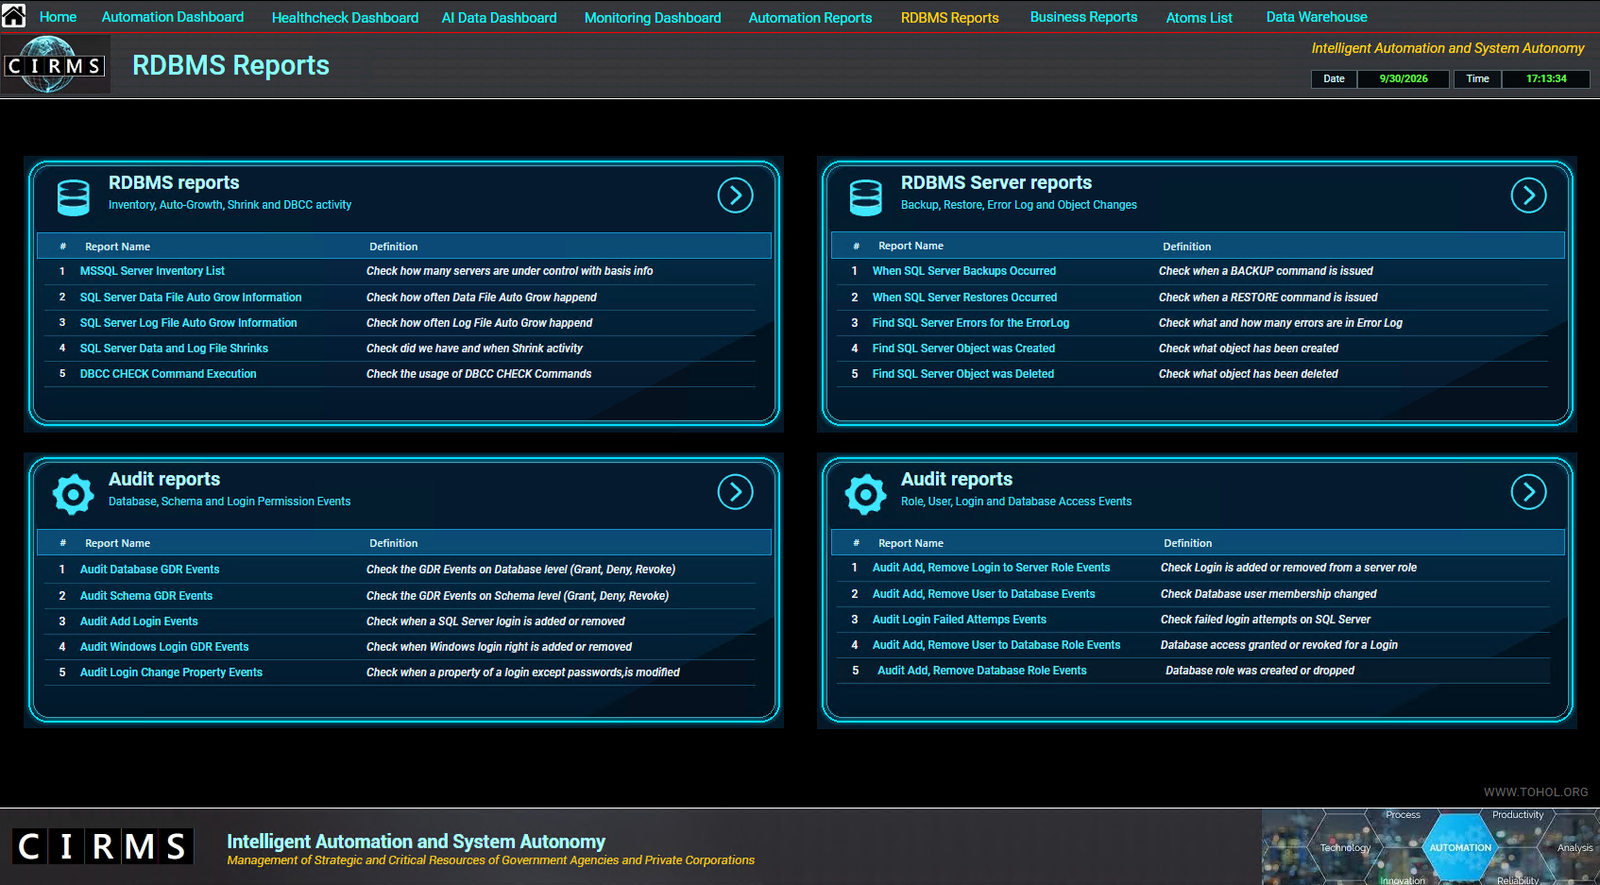
The Healthcheck Command Center provides a structured view of infrastructure and database health across the managed environment. It summarizes healthcheck results, healthy and unhealthy resources, critical and warning conditions, overall health score and the latest execution status. Detailed healthcheck groups cover database and SQL health, configuration, performance and capacity, maintenance and operations, services, and security and access.

  • Database and SQL health assessments
  • Configuration, performance, capacity and security checks
  • Critical, warning and total issue counts
  • Historical health trends and infrastructure status
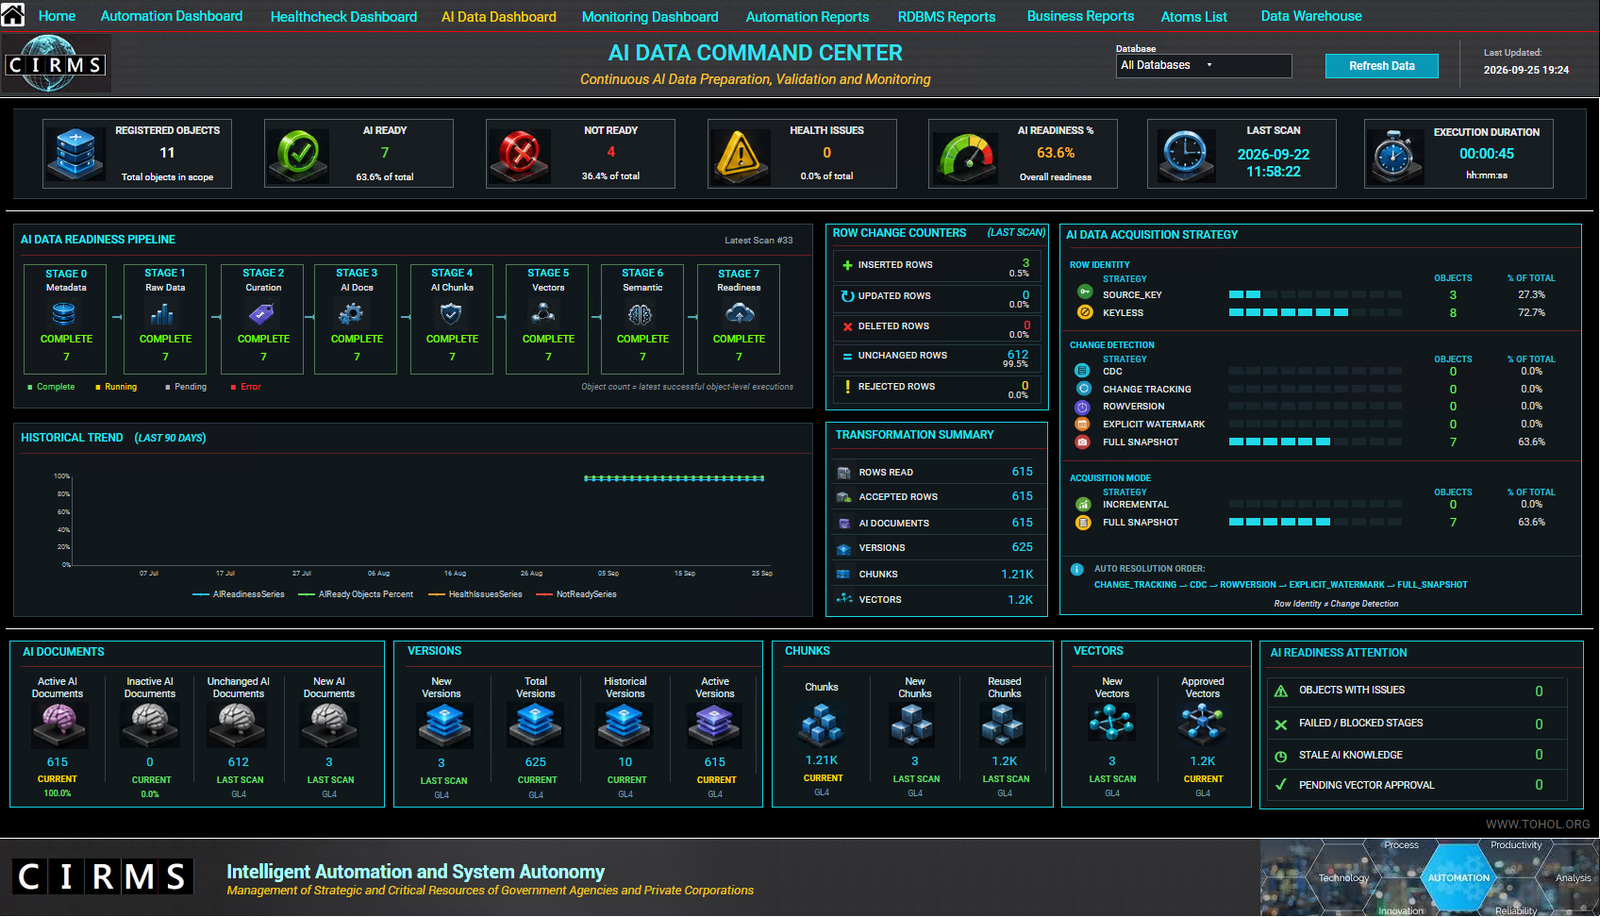
CIRMS AI Data Command Center showing AI Data Readiness pipeline stages, row-change counters, acquisition strategies, documents, versions, chunks and vectors.
GL4 AI Data Readiness

AI Data Command Center — AI Data Readiness and Knowledge Preparation

The AI Data Command Center provides visibility into the GL4 AI Data Readiness pipeline, from source registration and metadata processing through curation, document generation, chunking, vectorization, semantic validation and final readiness. It brings together registered-object status, AI-ready and not-ready objects, row-change counters, acquisition strategy, transformation metrics, documents, versions, chunks, vectors and readiness attention indicators.

  • Stage 0 → 7 AI Data Readiness pipeline
  • Row-change and transformation counters
  • Identity, change-detection and acquisition strategies
  • Documents, versions, chunks, vectors and readiness attention

One operational interface across GL3 and GL4.

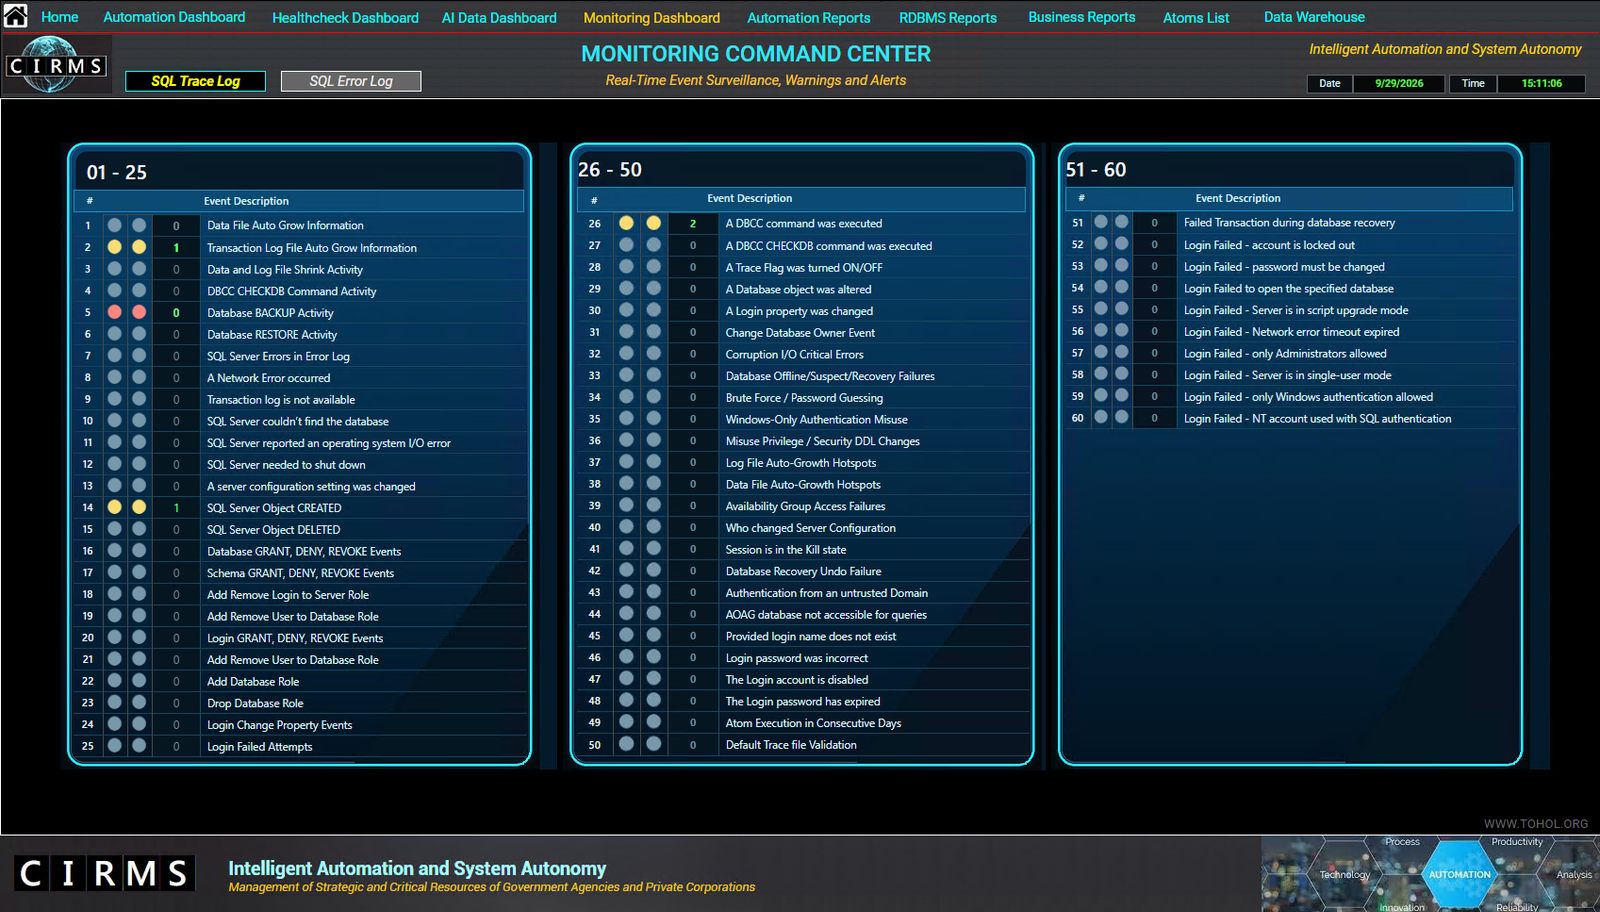
The four captures show how CIRMS moves from centralized system context to automation, proactive infrastructure health and AI-ready data preparation within a consistent command-center experience.

Explore capabilities